EX-99.2
Published on August 6, 2026

Q2 2026 EARNINGS PRESENTATION Jan Jenisch, Chairman and CEO Baris Oran, CFO August 7, 2026
2 SAFE HARBOR STATEMENT FORWARD-LOOKING STATEMENTS AND NON-GAAP FINANCIAL MEASURES Certain statements in this presentation may be considered forward-looking statements within the meaning of the Private Securities Litigation Reform Act, such as statements regarding expected cost savings, future financial targets, business strategies, management’s views with respect to future events and financial performance, and the assumptions underlying such expected cost savings, targets, strategies, and statements. Forward-looking statements include those preceded by, followed by or that include the words such as “may,” “will,” “could,” “should,” “might,” “projects,” “expects,” “believes,” “anticipates,” “intends,” “plans,” “continue,” “estimate,” or “pursue,” or similar expressions, or the negative or other variations thereof or comparable terms. Such forward-looking statements are subject to risks, uncertainties and other factors which could cause actual results to differ materially from historical experience or from future results expressed or implied by such forward-looking statements. Potential risks and uncertainties include, but are not limited to, the effect of political, economic and market conditions and geopolitical events; the level of demand in the construction industry; the cyclicality of the industries and businesses in which our customers operate; changes in the cost and/or availability of raw materials required to run our business; energy and fuel costs; adverse weather conditions and natural disasters; the logistical and other challenges inherent in our operations; the actions and initiatives of current and potential competitors; the level and volatility of, interest rates and other market indices; the ability of Amrize to realize the expected synergies for our acquisitions; the ability of Amrize to achieve margin expansion goals; the ability of Amrize to maintain satisfactory credit ratings; the outcome of pending litigation or future litigation; the impact of current, pending and future legislation and regulation; factors related to the failure of Amrize to achieve some or all of the expected strategic benefits or opportunities expected from the separation from Holcim Ltd (“Holcim”); material costs and expenses as a result of the separation from Holcim; our limited history operating as an independent, publicly traded company; our obligation to indemnify Holcim pursuant to the agreements entered into connection with the separation and the risk Holcim may not fulfill any obligations to indemnify Amrize under such agreements; that under applicable tax law, Amrize may be liable for certain tax liabilities of Holcim following the separation if Holcim were to fail to pay such taxes; the fact that Amrize may receive worse commercial terms from third-parties for services it used to receive from Holcim prior to the separation; the fact that certain of Amrize's executive officers and directors may have actual or potential conflicts of interest because of their previous positions at Holcim; and potential difficulties in maintaining relationships with key personnel; and other factors which can be found in Amrize’s media releases and Amrize’s filings with the SEC. These statements are not guarantees of future performance and are subject to future events, risks and uncertainties – many of which are beyond our control, dependent on the actions of third parties, or currently unknown to us – as well as potentially inaccurate assumptions that could cause actual results to differ materially from our historical experience and our expectations and projections. Any forward-looking statement speaks only as of the date on which it is made. We do not undertake or assume any obligation to update or revise any forward-looking statement, whether as a result of new information, future developments, or otherwise. You are advised, however, to review any further disclosures we make on related subjects in our filings with the Securities and Exchange Commission and in our other public statements. Amrize reports its financial results in accordance with accounting principles generally accepted in the United States (“GAAP”). We have supplemented the reporting of our financial information determined in accordance with GAAP with certain Non-GAAP (or adjusted) financial measures, including Adjusted EBITDA, Adjusted EBITDA Margin, Segment Adjusted EBITDA, Segment Adjusted EBITDA Margin and Net Leverage Ratio. Reconciliations of Non-GAAP measures used in this presentation to the most directly comparable U.S. GAAP measures are included below under “Appendix.” We believe these adjusted financial measures facilitate analysis and comparisons of our ongoing business operations because they exclude items that may not be indicative of, or are unrelated to, the Company’s and our business segments’ core operating performance, and may assist investors with comparisons to prior periods and assessing trends in our underlying businesses. These adjustments are consistent with how management views our businesses. Management uses these Non- GAAP financial measures in making financial, operating and planning decisions, and evaluating Amrize’s and each business segment’s ongoing performance. Note that the definitions of these Non-GAAP financial measures may differ from those terms as defined or used by other companies. This presentation should be reviewed in conjunction with our second quarter fiscal 2026 earnings release and webcast of the earnings presentation conference call, which are available on Amrize’s website at investors.amrize.com.
3 Winthrop Center, Boston, MA Amrize inside Q2 2026 HIGHLIGHTS Jan Jenisch, Chairman and CEO
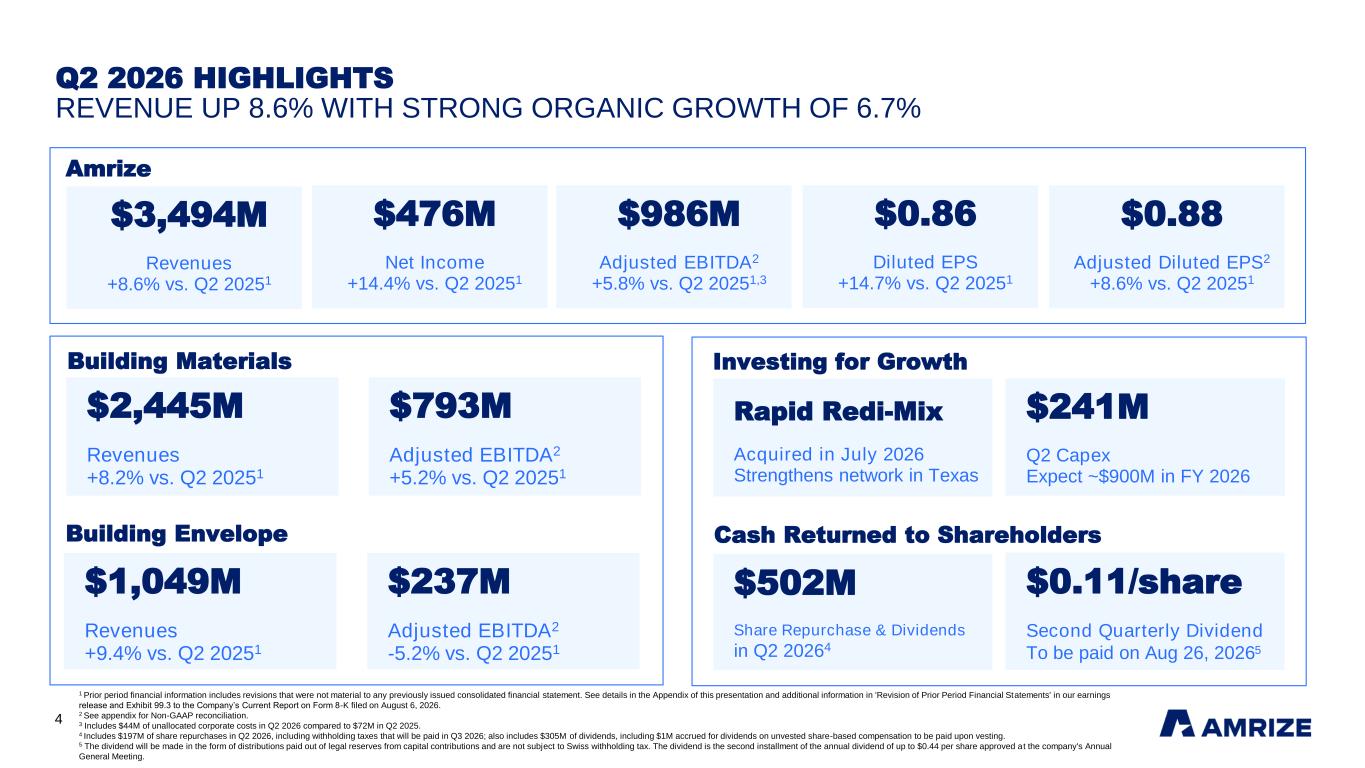
4 Q2 2026 HIGHLIGHTS REVENUE UP 8.6% WITH STRONG ORGANIC GROWTH OF 6.7% 1 Prior period financial information includes revisions that were not material to any previously issued consolidated financial statement. See details in the Appendix of this presentation and additional information in 'Revision of Prior Period Financial Statements' in our earnings release and Exhibit 99.3 to the Company’s Current Report on Form 8-K filed on August 6, 2026. 2 See appendix for Non-GAAP reconciliation. 3 Includes $44M of unallocated corporate costs in Q2 2026 compared to $72M in Q2 2025. 4 Includes $197M of share repurchases in Q2 2026, including withholding taxes that will be paid in Q3 2026; also includes $305M of dividends, including $1M accrued for dividends on unvested share-based compensation to be paid upon vesting. 5 The dividend will be made in the form of distributions paid out of legal reserves from capital contributions and are not subject to Swiss withholding tax. The dividend is the second installment of the annual dividend of up to $0.44 per share approved at the company's Annual General Meeting. $2,445M Revenues +8.2% vs. Q2 20251 $793M Adjusted EBITDA2 +5.2% vs. Q2 20251 $1,049M Revenues +9.4% vs. Q2 20251 $237M Adjusted EBITDA2 -5.2% vs. Q2 20251 Building Materials Building Envelope $3,494M Revenues +8.6% vs. Q2 20251 $986M Adjusted EBITDA2 +5.8% vs. Q2 20251,3 Amrize Rapid Redi-Mix Acquired in July 2026 Strengthens network in Texas $502M Share Repurchase & Dividends in Q2 20264 Investing for Growth $0.11/share Second Quarterly Dividend To be paid on Aug 26, 20265 Cash Returned to Shareholders $241M Q2 Capex Expect ~$900M in FY 2026 $476M Net Income +14.4% vs. Q2 20251 $0.88 Adjusted Diluted EPS2 +8.6% vs. Q2 20251 $0.86 Diluted EPS +14.7% vs. Q2 20251
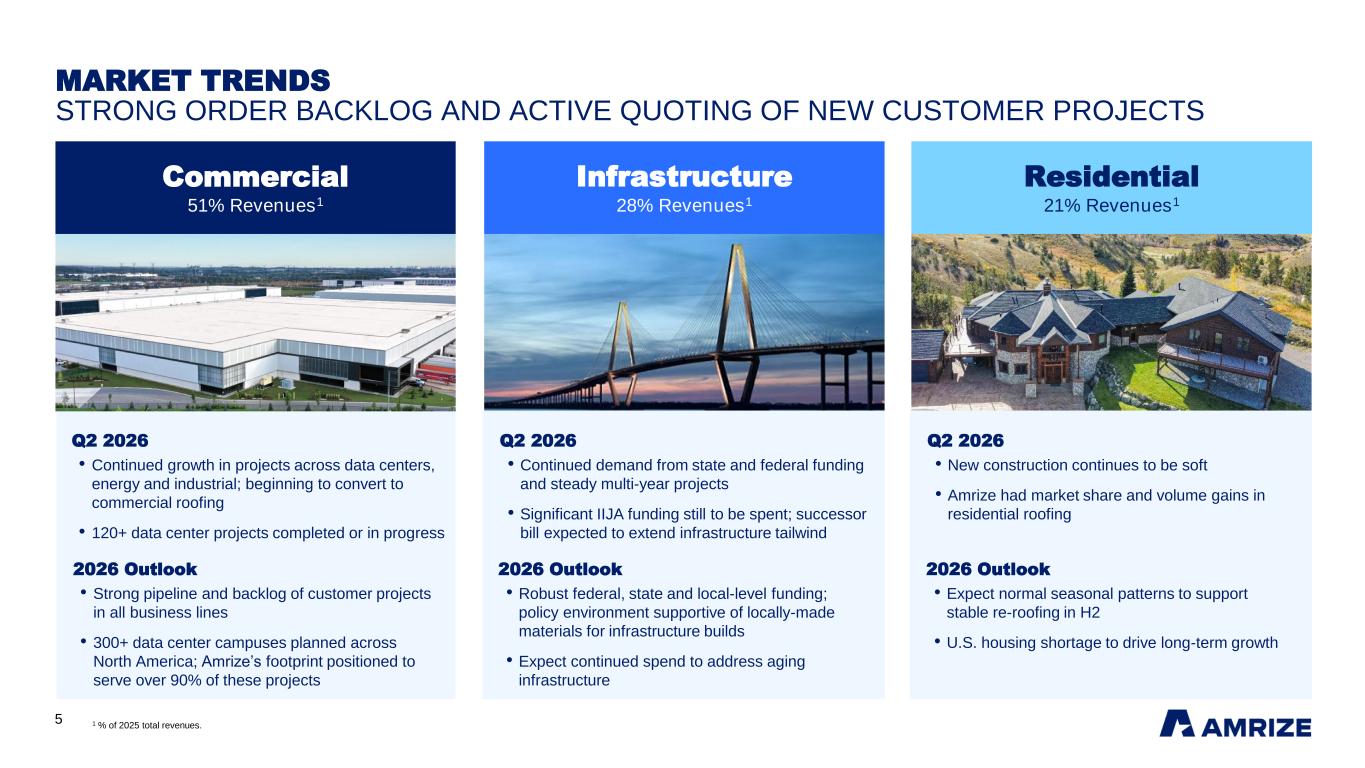
5 Commercial 51% Revenues1 Infrastructure 28% Revenues1 Residential 21% Revenues1 MARKET TRENDS STRONG ORDER BACKLOG AND ACTIVE QUOTING OF NEW CUSTOMER PROJECTS 1 % of 2025 total revenues. 2026 Outlook • Strong pipeline and backlog of customer projects in all business lines • 300+ data center campuses planned across North America; Amrize’s footprint positioned to serve over 90% of these projects Q2 2026 • Continued growth in projects across data centers, energy and industrial; beginning to convert to commercial roofing • 120+ data center projects completed or in progress 2026 Outlook • Robust federal, state and local-level funding; policy environment supportive of locally-made materials for infrastructure builds • Expect continued spend to address aging infrastructure Q2 2026 • Continued demand from state and federal funding and steady multi-year projects • Significant IIJA funding still to be spent; successor bill expected to extend infrastructure tailwind 2026 Outlook • Expect normal seasonal patterns to support stable re-roofing in H2 • U.S. housing shortage to drive long-term growth Q2 2026 • New construction continues to be soft • Amrize had market share and volume gains in residential roofing
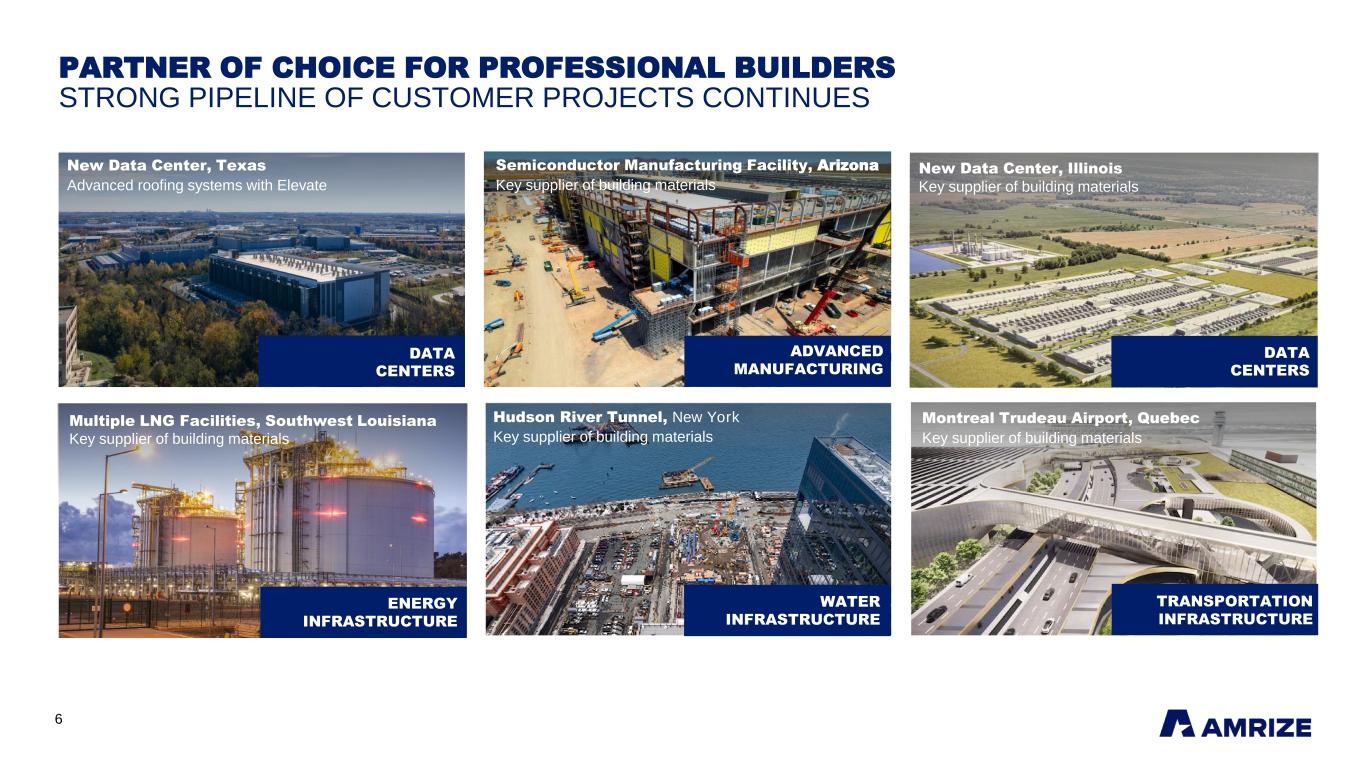
6 PARTNER OF CHOICE FOR PROFESSIONAL BUILDERS STRONG PIPELINE OF CUSTOMER PROJECTS CONTINUES Montreal Trudeau Airport, Quebec Key supplier of building materials DATA CENTERS TRANSPORTATION INFRASTRUCTURE New Data Center, Illinois Key supplier of building materials DATA CENTERS New Data Center, Texas Advanced roofing systems with Elevate Hudson River Tunnel, New York Key supplier of building materials WATER INFRASTRUCTURE ADVANCED MANUFACTURING Semiconductor Manufacturing Facility, Arizona Key supplier of building materials Multiple LNG Facilities, Southwest Louisiana Key supplier of building materials ENERGY INFRASTRUCTURE
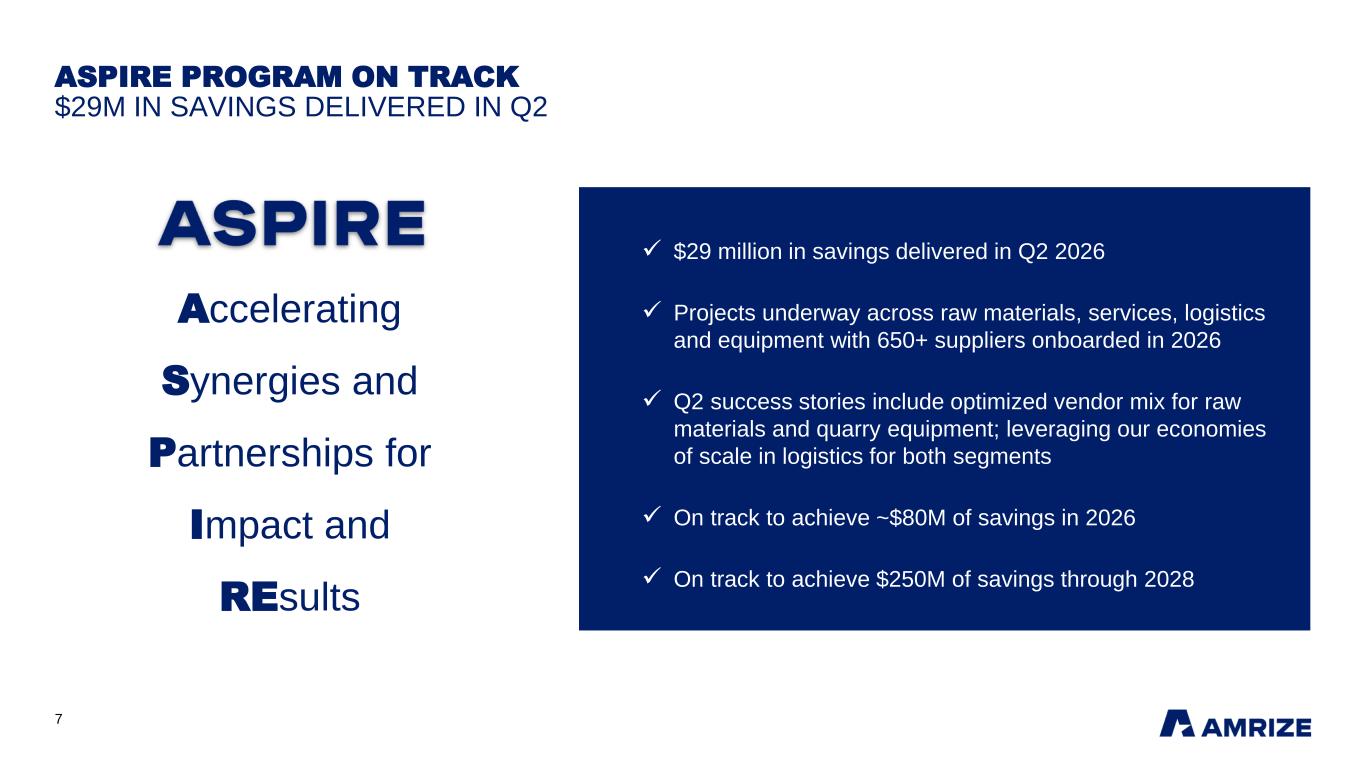
7 Accelerating Synergies and Partnerships for Impact and REsults ASPIRE PROGRAM ON TRACK $29M IN SAVINGS DELIVERED IN Q2 ✓ $29 million in savings delivered in Q2 2026 ✓ Projects underway across raw materials, services, logistics and equipment with 650+ suppliers onboarded in 2026 ✓ Q2 success stories include optimized vendor mix for raw materials and quarry equipment; leveraging our economies of scale in logistics for both segments ✓ On track to achieve ~$80M of savings in 2026 ✓ On track to achieve $250M of savings through 2028
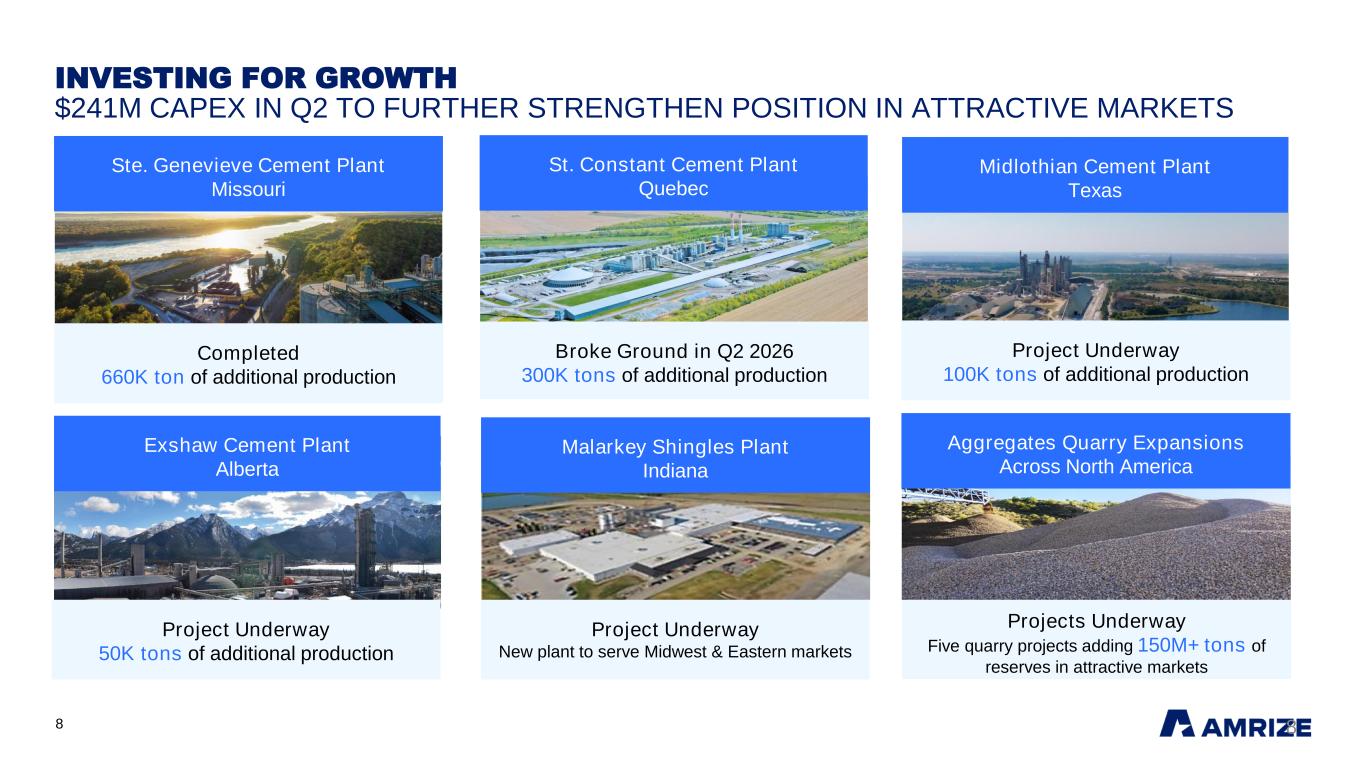
8 Exshaw Cement Plant Alberta St. Constant Cement Plant Quebec Ste. Genevieve Cement Plant Missouri Malarkey Shingles Plant Indiana Aggregates Quarry Expansions Across North America Completed 660K ton of additional production Project Underway 100K tons of additional production Project Underway New plant to serve Midwest & Eastern markets Projects Underway Five quarry projects adding 150M+ tons of reserves in attractive markets INVESTING FOR GROWTH $241M CAPEX IN Q2 TO FURTHER STRENGTHEN POSITION IN ATTRACTIVE MARKETS Midlothian Cement Plant Texas Broke Ground in Q2 2026 300K tons of additional production Project Underway 50K tons of additional production 8
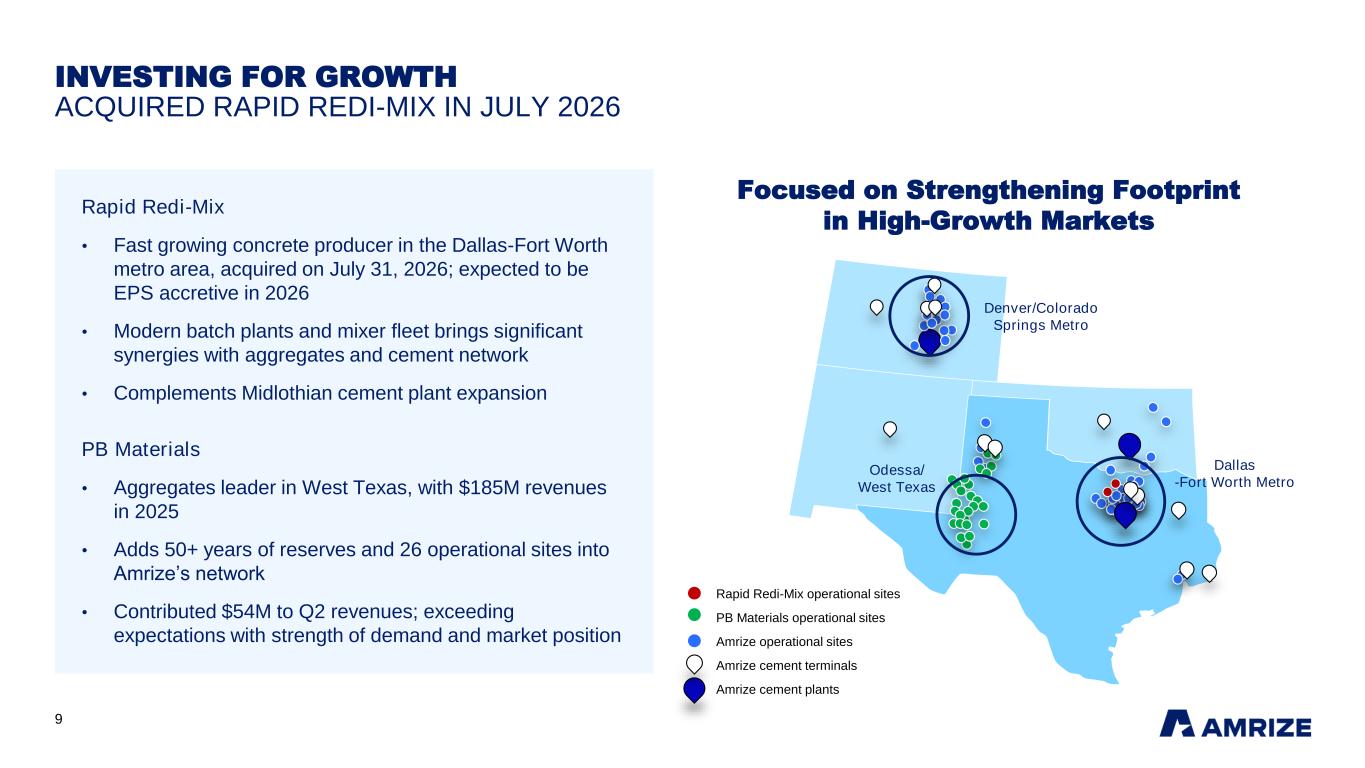
9 INVESTING FOR GROWTH ACQUIRED RAPID REDI-MIX IN JULY 2026 Rapid Redi-Mix • Fast growing concrete producer in the Dallas-Fort Worth metro area, acquired on July 31, 2026; expected to be EPS accretive in 2026 • Modern batch plants and mixer fleet brings significant synergies with aggregates and cement network • Complements Midlothian cement plant expansion PB Materials • Aggregates leader in West Texas, with $185M revenues in 2025 • Adds 50+ years of reserves and 26 operational sites into Amrize’s network • Contributed $54M to Q2 revenues; exceeding expectations with strength of demand and market position Rapid Redi-Mix operational sites PB Materials operational sites Amrize operational sites Amrize cement terminals Amrize cement plants Focused on Strengthening Footprint in High-Growth Markets Dallas -Fort Worth Metro Denver/Colorado Springs Metro Odessa/ West Texas
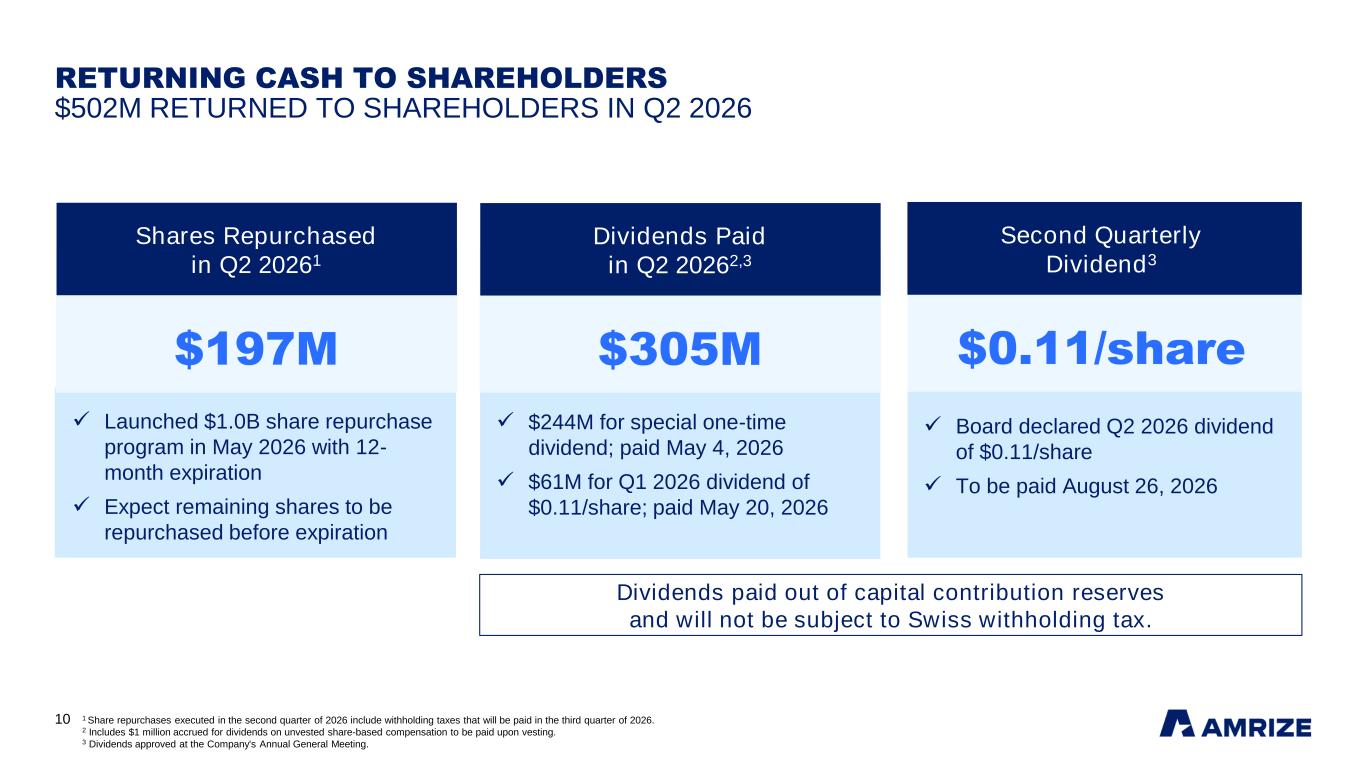
10 RETURNING CASH TO SHAREHOLDERS $502M RETURNED TO SHAREHOLDERS IN Q2 2026 $197M Shares Repurchased in Q2 20261 $0.11/share Second Quarterly Dividend3 $305M Dividends Paid in Q2 20262,3 Dividends paid out of capital contribution reserves and will not be subject to Swiss withholding tax. 1 Share repurchases executed in the second quarter of 2026 include withholding taxes that will be paid in the third quarter of 2026. 2 Includes $1 million accrued for dividends on unvested share-based compensation to be paid upon vesting. 3 Dividends approved at the Company's Annual General Meeting. ✓ Launched $1.0B share repurchase program in May 2026 with 12- month expiration ✓ Expect remaining shares to be repurchased before expiration ✓ $244M for special one-time dividend; paid May 4, 2026 ✓ $61M for Q1 2026 dividend of $0.11/share; paid May 20, 2026 ✓ Board declared Q2 2026 dividend of $0.11/share ✓ To be paid August 26, 2026
11 Logistics center, Toronto, ON Amrize inside Q2 2026 RESULTS Baris Oran, CFO
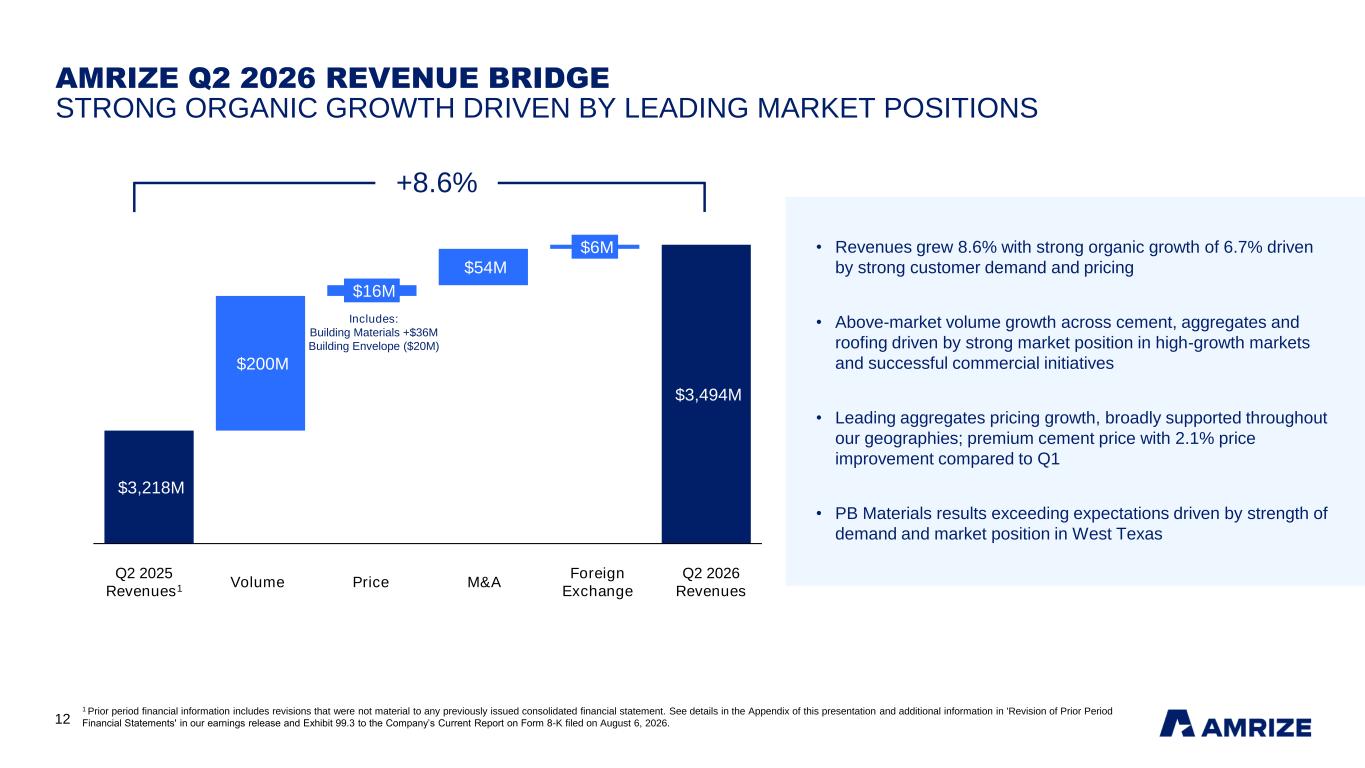
12 AMRIZE Q2 2026 REVENUE BRIDGE STRONG ORGANIC GROWTH DRIVEN BY LEADING MARKET POSITIONS $3,218M $3,488M $3,494M $200M $16M $54M $6M 1 2 3 4 5 6 Q2 2025 Revenues1 Volume Price M&A Foreign Exchange Q2 2026 Revenues +8.6% 1 Prior period financial information includes revisions that were not material to any previously issued consolidated financial statement. See details in the Appendix of this presentation and additional information in 'Revision of Prior Period Financial Statements' in our earnings release and Exhibit 99.3 to the Company’s Current Report on Form 8-K filed on August 6, 2026. • Revenues grew 8.6% with strong organic growth of 6.7% driven by strong customer demand and pricing • Above-market volume growth across cement, aggregates and roofing driven by strong market position in high-growth markets and successful commercial initiatives • Leading aggregates pricing growth, broadly supported throughout our geographies; premium cement price with 2.1% price improvement compared to Q1 • PB Materials results exceeding expectations driven by strength of demand and market position in West Texas Includes: Building Materials +$36M Building Envelope ($20M)
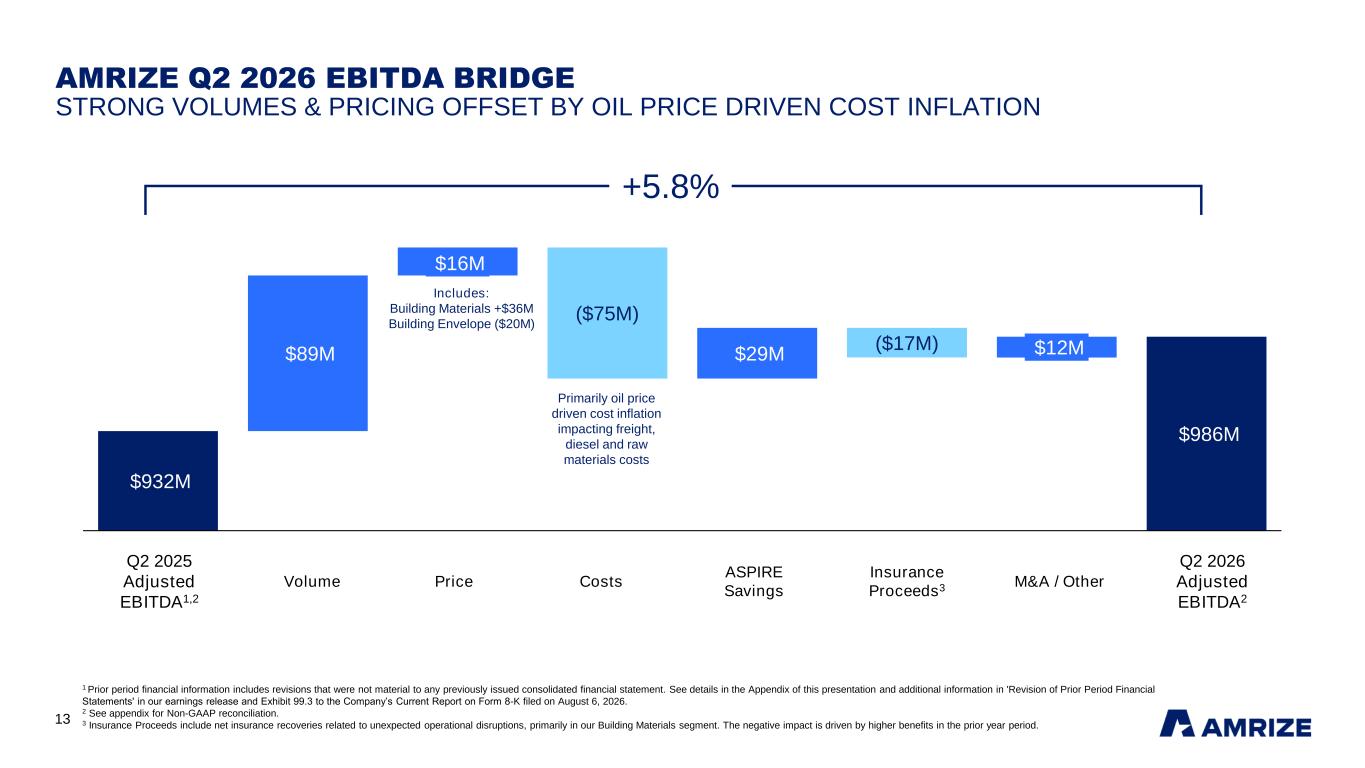
13 $932M $962M $974M $974M $986M $89M $16M ($75M) $29M ($17M) $12M 1 2 3 4 5 6 7 8 +5.8% Q2 2025 Adjusted EBITDA1,2 Volume Price Costs ASPIRE Savings Insurance Proceeds3 M&A / Other Q2 2026 Adjusted EBITDA2 AMRIZE Q2 2026 EBITDA BRIDGE STRONG VOLUMES & PRICING OFFSET BY OIL PRICE DRIVEN COST INFLATION 1 Prior period financial information includes revisions that were not material to any previously issued consolidated financial statement. See details in the Appendix of this presentation and additional information in 'Revision of Prior Period Financial Statements' in our earnings release and Exhibit 99.3 to the Company’s Current Report on Form 8-K filed on August 6, 2026. 2 See appendix for Non-GAAP reconciliation. 3 Insurance Proceeds include net insurance recoveries related to unexpected operational disruptions, primarily in our Building Materials segment. The negative impact is driven by higher benefits in the prior year period. Includes: Building Materials +$36M Building Envelope ($20M) Primarily oil price driven cost inflation impacting freight, diesel and raw materials costs
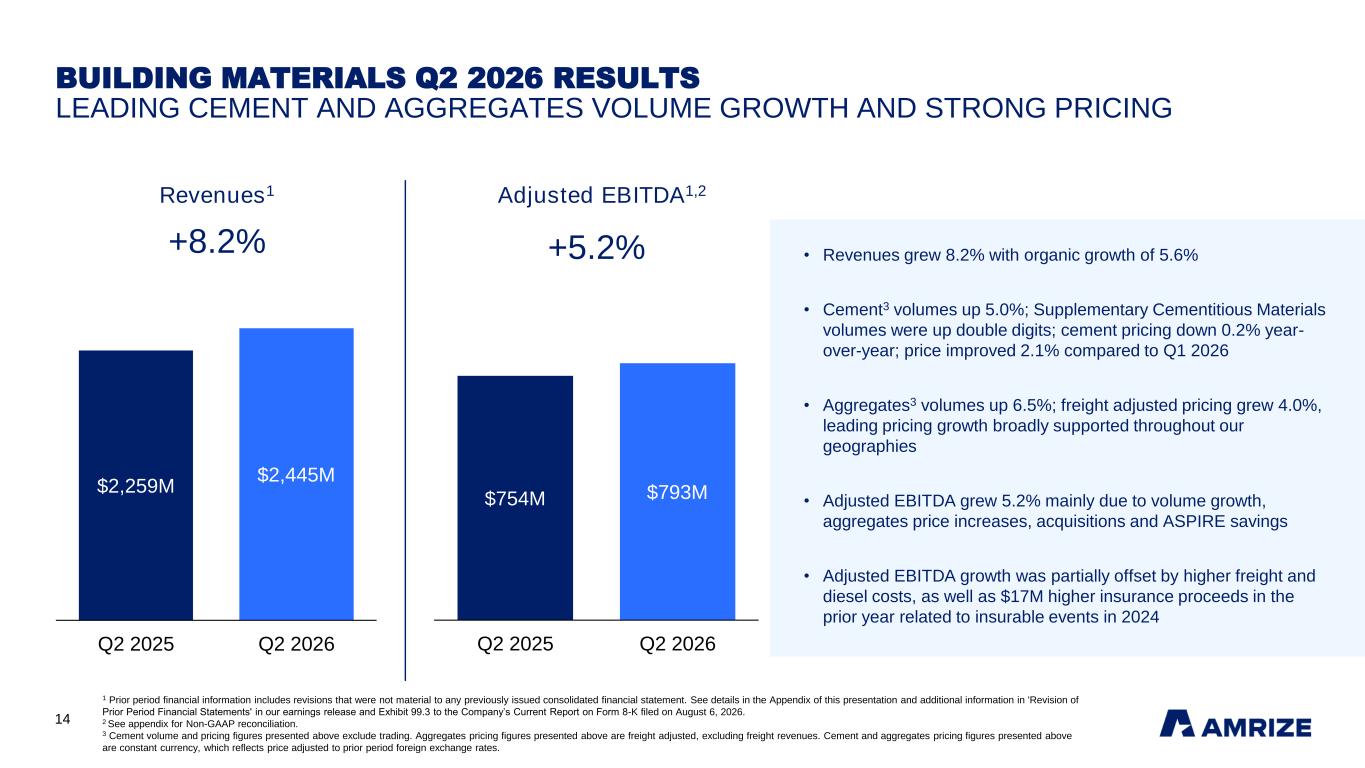
14 BUILDING MATERIALS Q2 2026 RESULTS LEADING CEMENT AND AGGREGATES VOLUME GROWTH AND STRONG PRICING 1 Prior period financial information includes revisions that were not material to any previously issued consolidated financial statement. See details in the Appendix of this presentation and additional information in 'Revision of Prior Period Financial Statements' in our earnings release and Exhibit 99.3 to the Company’s Current Report on Form 8-K filed on August 6, 2026. 2 See appendix for Non-GAAP reconciliation. 3 Cement volume and pricing figures presented above exclude trading. Aggregates pricing figures presented above are freight adjusted, excluding freight revenues. Cement and aggregates pricing figures presented above are constant currency, which reflects price adjusted to prior period foreign exchange rates. $2,259M $2,445M Q2 2025 Q2 2026 $754M $793M Q2 2025 Q2 2026 Adjusted EBITDA1,2Revenues1 +8.2% +5.2% • Revenues grew 8.2% with organic growth of 5.6% • Cement3 volumes up 5.0%; Supplementary Cementitious Materials volumes were up double digits; cement pricing down 0.2% year- over-year; price improved 2.1% compared to Q1 2026 • Aggregates3 volumes up 6.5%; freight adjusted pricing grew 4.0%, leading pricing growth broadly supported throughout our geographies • Adjusted EBITDA grew 5.2% mainly due to volume growth, aggregates price increases, acquisitions and ASPIRE savings • Adjusted EBITDA growth was partially offset by higher freight and diesel costs, as well as $17M higher insurance proceeds in the prior year related to insurable events in 2024
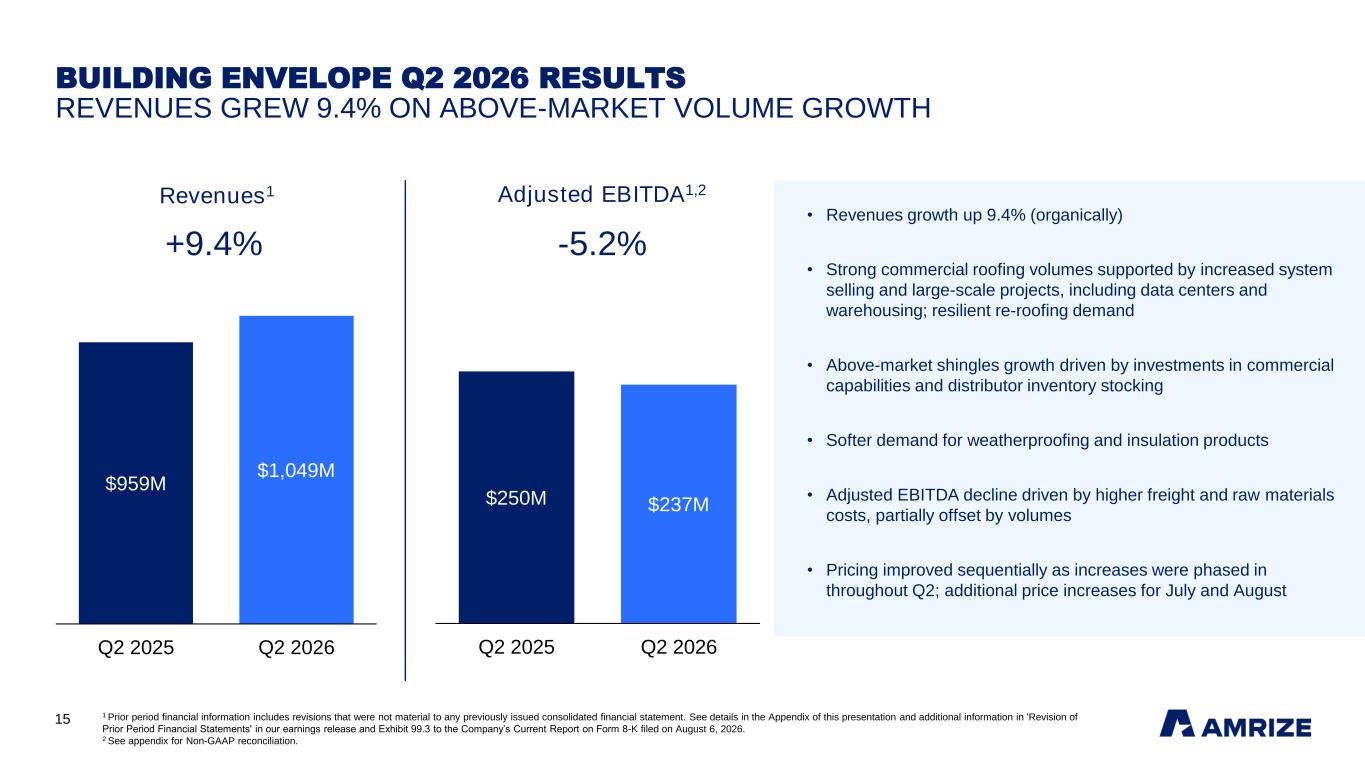
15 BUILDING ENVELOPE Q2 2026 RESULTS REVENUES GREW 9.4% ON ABOVE-MARKET VOLUME GROWTH $959M $1,049M Q2 2025 Q2 2026 $250M $237M Q2 2025 Q2 2026 1 Prior period financial information includes revisions that were not material to any previously issued consolidated financial statement. See details in the Appendix of this presentation and additional information in 'Revision of Prior Period Financial Statements' in our earnings release and Exhibit 99.3 to the Company’s Current Report on Form 8-K filed on August 6, 2026. 2 See appendix for Non-GAAP reconciliation. Adjusted EBITDA1,2Revenues1 +9.4% -5.2% • Revenues growth up 9.4% (organically) • Strong commercial roofing volumes supported by increased system selling and large-scale projects, including data centers and warehousing; resilient re-roofing demand • Above-market shingles growth driven by investments in commercial capabilities and distributor inventory stocking • Softer demand for weatherproofing and insulation products • Adjusted EBITDA decline driven by higher freight and raw materials costs, partially offset by volumes • Pricing improved sequentially as increases were phased in throughout Q2; additional price increases for July and August
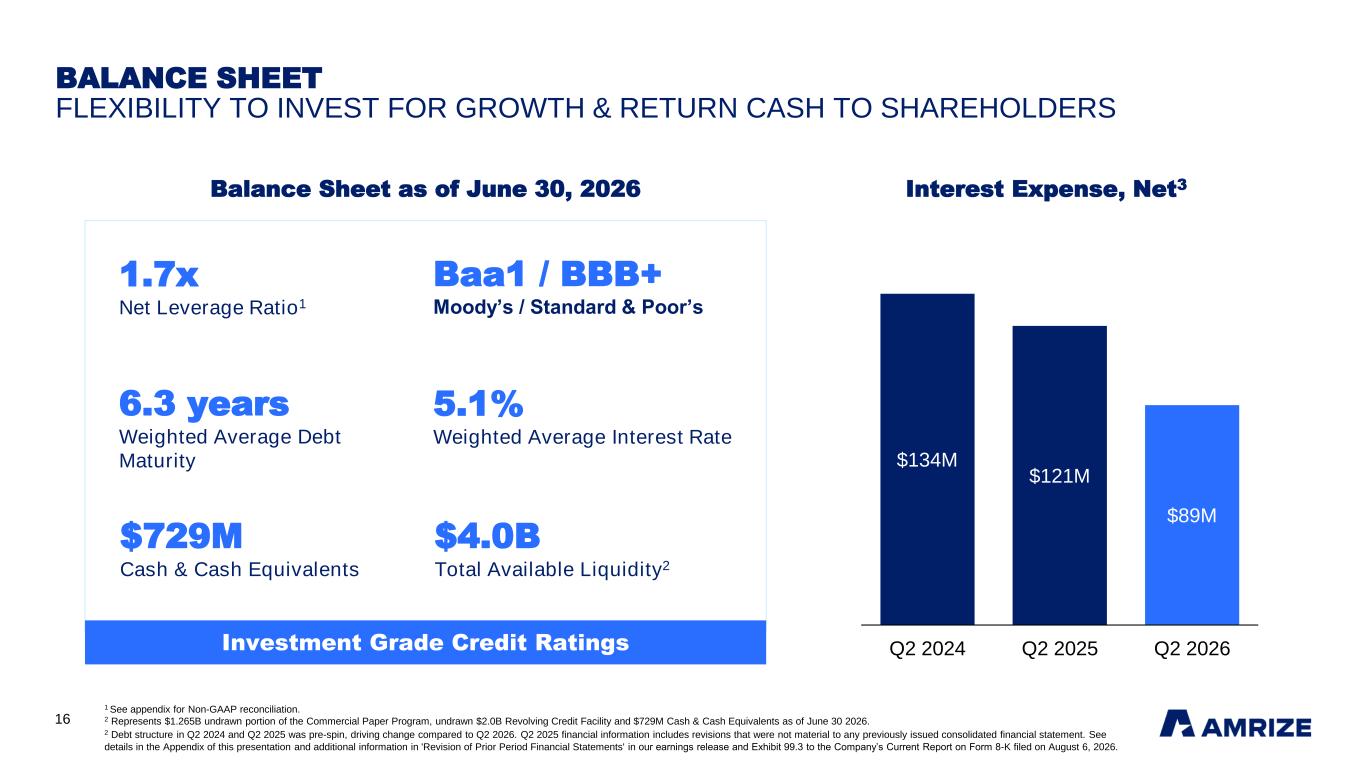
16 BALANCE SHEET FLEXIBILITY TO INVEST FOR GROWTH & RETURN CASH TO SHAREHOLDERS Balance Sheet as of June 30, 2026 Baa1 / BBB+ Moody’s / Standard & Poor’s $729M Cash & Cash Equivalents 1 See appendix for Non-GAAP reconciliation. 2 Represents $1.265B undrawn portion of the Commercial Paper Program, undrawn $2.0B Revolving Credit Facility and $729M Cash & Cash Equivalents as of June 30 2026. 2 Debt structure in Q2 2024 and Q2 2025 was pre-spin, driving change compared to Q2 2026. Q2 2025 financial information includes revisions that were not material to any previously issued consolidated financial statement. See details in the Appendix of this presentation and additional information in 'Revision of Prior Period Financial Statements' in our earnings release and Exhibit 99.3 to the Company’s Current Report on Form 8-K filed on August 6, 2026. 1.7x Net Leverage Ratio1 $134M $121M $89M Q2 2024 Q2 2025 Q2 2026 Interest Expense, Net3 $4.0B Total Available Liquidity2 6.3 years Weighted Average Debt Maturity 5.1% Weighted Average Interest Rate Investment Grade Credit Ratings
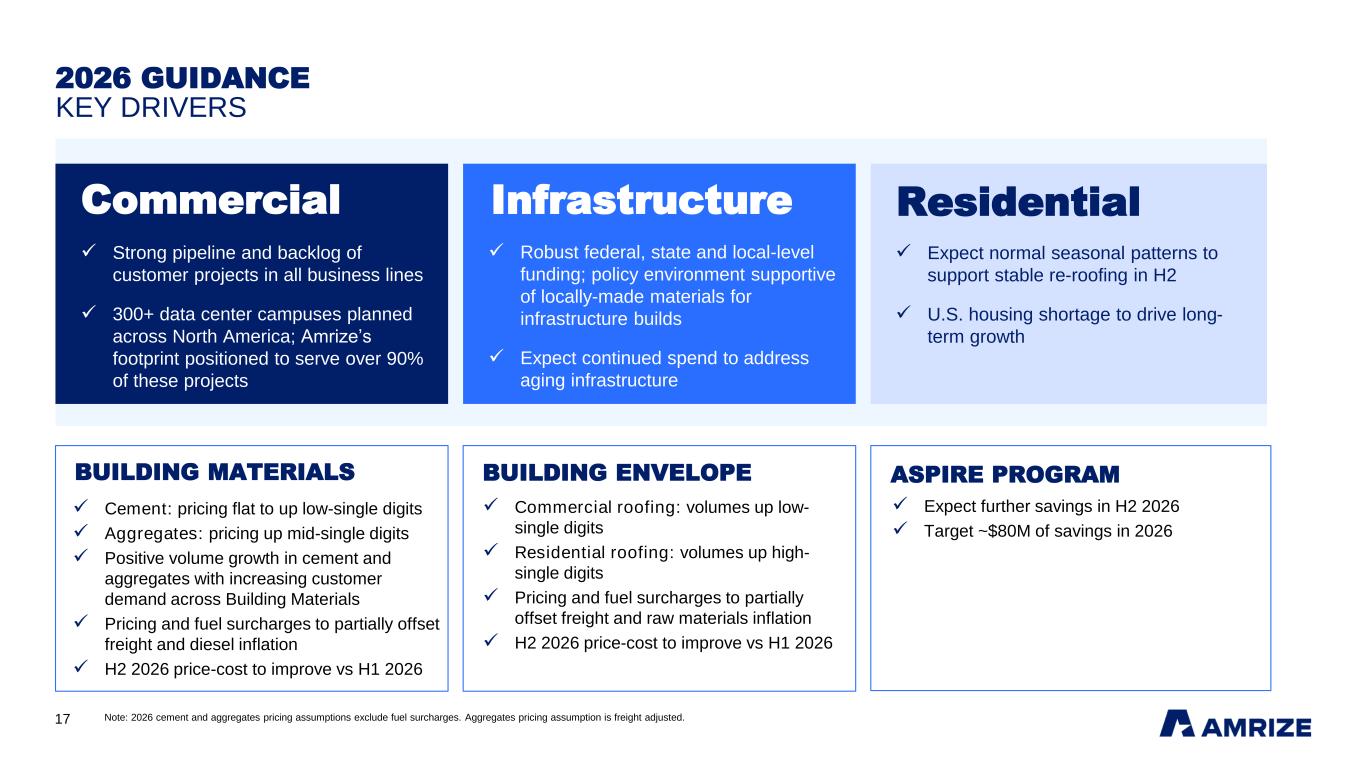
17 2026 GUIDANCE KEY DRIVERS InfrastructureCommercial Residential BUILDING MATERIALS ASPIRE PROGRAMBUILDING ENVELOPE Note: 2026 cement and aggregates pricing assumptions exclude fuel surcharges. Aggregates pricing assumption is freight adjusted. ✓ Expect normal seasonal patterns to support stable re-roofing in H2 ✓ U.S. housing shortage to drive long- term growth ✓ Robust federal, state and local-level funding; policy environment supportive of locally-made materials for infrastructure builds ✓ Expect continued spend to address aging infrastructure ✓ Strong pipeline and backlog of customer projects in all business lines ✓ 300+ data center campuses planned across North America; Amrize’s footprint positioned to serve over 90% of these projects ✓ Cement: pricing flat to up low-single digits ✓ Aggregates: pricing up mid-single digits ✓ Positive volume growth in cement and aggregates with increasing customer demand across Building Materials ✓ Pricing and fuel surcharges to partially offset freight and diesel inflation ✓ H2 2026 price-cost to improve vs H1 2026 ✓ Commercial roofing: volumes up low- single digits ✓ Residential roofing: volumes up high- single digits ✓ Pricing and fuel surcharges to partially offset freight and raw materials inflation ✓ H2 2026 price-cost to improve vs H1 2026 ✓ Expect further savings in H2 2026 ✓ Target ~$80M of savings in 2026
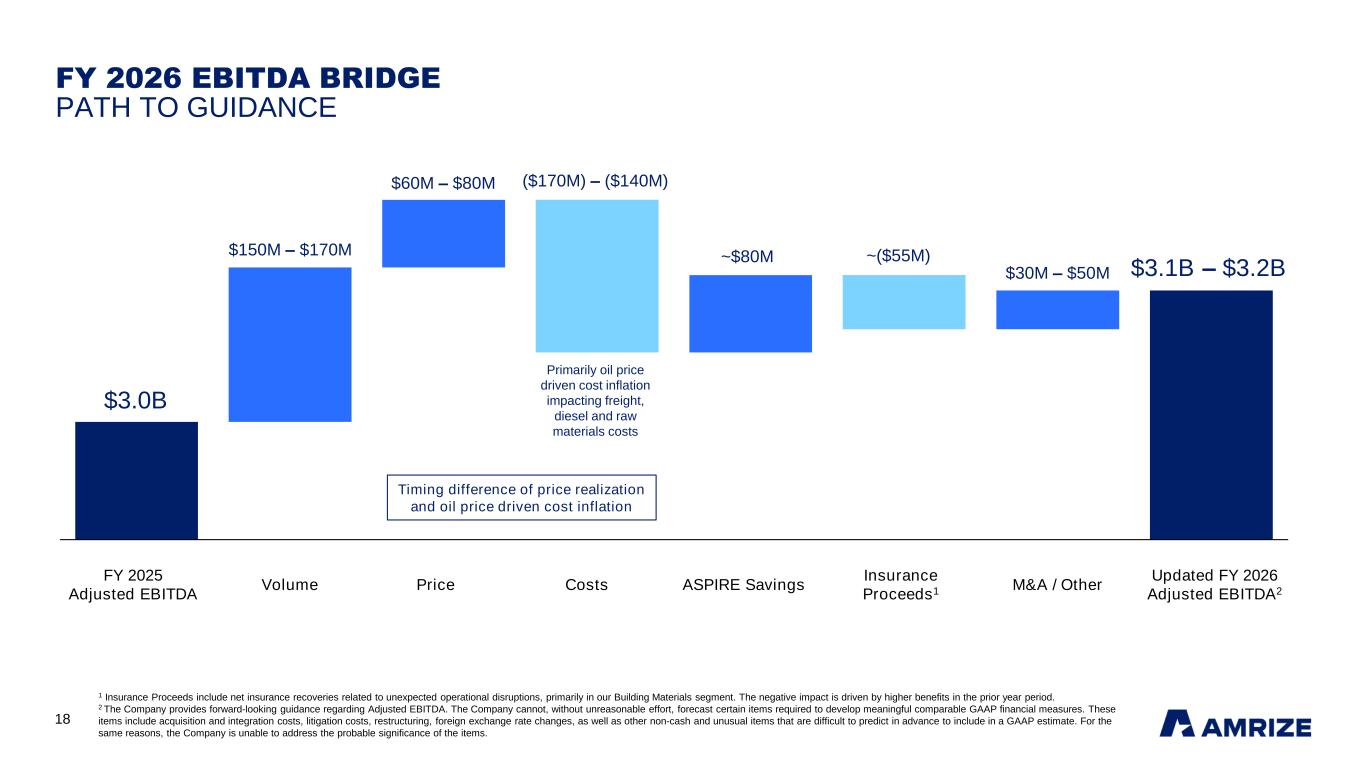
18 1 2 3 4 5 6 7 8 FY 2026 EBITDA BRIDGE PATH TO GUIDANCE 1 Insurance Proceeds include net insurance recoveries related to unexpected operational disruptions, primarily in our Building Materials segment. The negative impact is driven by higher benefits in the prior year period. 2 The Company provides forward-looking guidance regarding Adjusted EBITDA. The Company cannot, without unreasonable effort, forecast certain items required to develop meaningful comparable GAAP financial measures. These items include acquisition and integration costs, litigation costs, restructuring, foreign exchange rate changes, as well as other non-cash and unusual items that are difficult to predict in advance to include in a GAAP estimate. For the same reasons, the Company is unable to address the probable significance of the items. FY 2025 Adjusted EBITDA Volume Price Costs ASPIRE Savings Insurance Proceeds1 M&A / Other Updated FY 2026 Adjusted EBITDA2 $3.1B – $3.2B ($170M) – ($140M)$60M – $80M $30M – $50M $150M – $170M Timing difference of price realization and oil price driven cost inflation $3.0B ~$80M ~($55M) Primarily oil price driven cost inflation impacting freight, diesel and raw materials costs
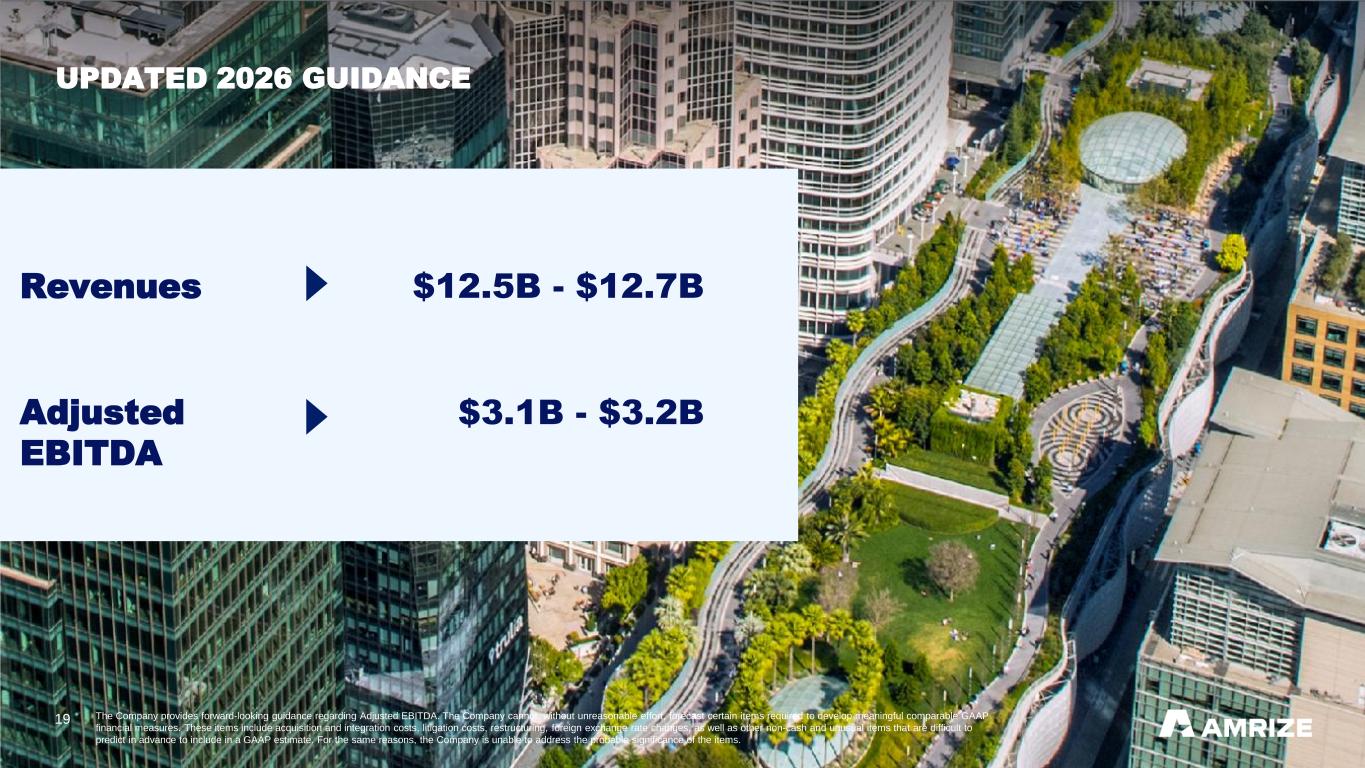
19 UPDATED 2026 GUIDANCE Revenues $12.5B - $12.7B Adjusted EBITDA $3.1B - $3.2B The Company provides forward-looking guidance regarding Adjusted EBITDA. The Company cannot, without unreasonable effort, forecast certain items required to develop meaningful comparable GAAP financial measures. These items include acquisition and integration costs, litigation costs, restructuring, foreign exchange rate changes, as well as other non-cash and unusual items that are difficult to predict in advance to include in a GAAP estimate. For the same reasons, the Company is unable to address the probable significance of the items.
20 One World Trade Center, New York, NY Amrize inside APPENDIX
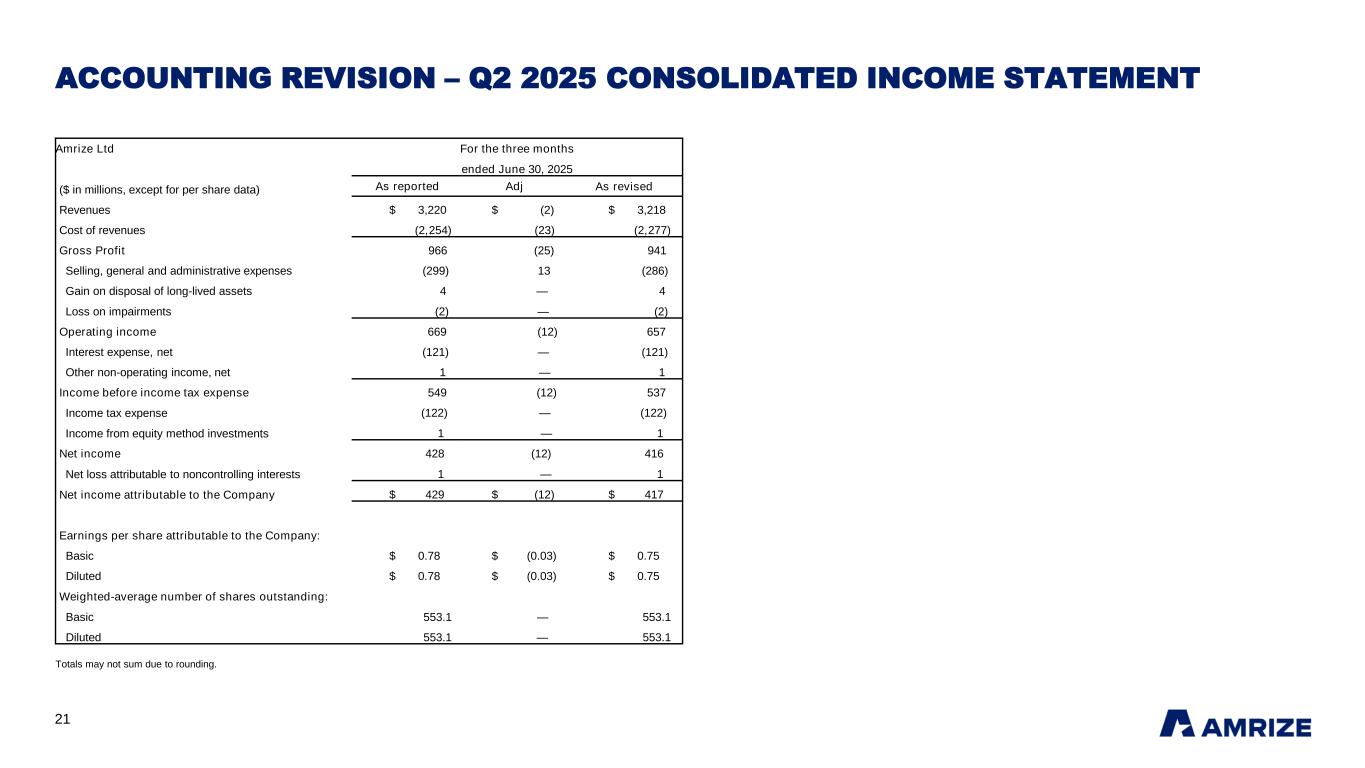
21 ACCOUNTING REVISION – Q2 2025 CONSOLIDATED INCOME STATEMENT Totals may not sum due to rounding. Amrize Ltd For the three months ended June 30, 2025 ($ in millions, except for per share data) As reported Adj As revised Revenues $ 3,220 $ (2) $ 3,218 Cost of revenues (2,254) (23) (2,277) Gross Profit 966 (25) 941 Selling, general and administrative expenses (299) 13 (286) Gain on disposal of long-lived assets 4 — 4 Loss on impairments (2) — (2) Operating income 669 (12) 657 Interest expense, net (121) — (121) Other non-operating income, net 1 — 1 Income before income tax expense 549 (12) 537 Income tax expense (122) — (122) Income from equity method investments 1 — 1 Net income 428 (12) 416 Net loss attributable to noncontrolling interests 1 — 1 Net income attributable to the Company $ 429 $ (12) $ 417 Earnings per share attributable to the Company: Basic $ 0.78 $ (0.03) $ 0.75 Diluted $ 0.78 $ (0.03) $ 0.75 Weighted-average number of shares outstanding: Basic 553.1 — 553.1 Diluted 553.1 — 553.1
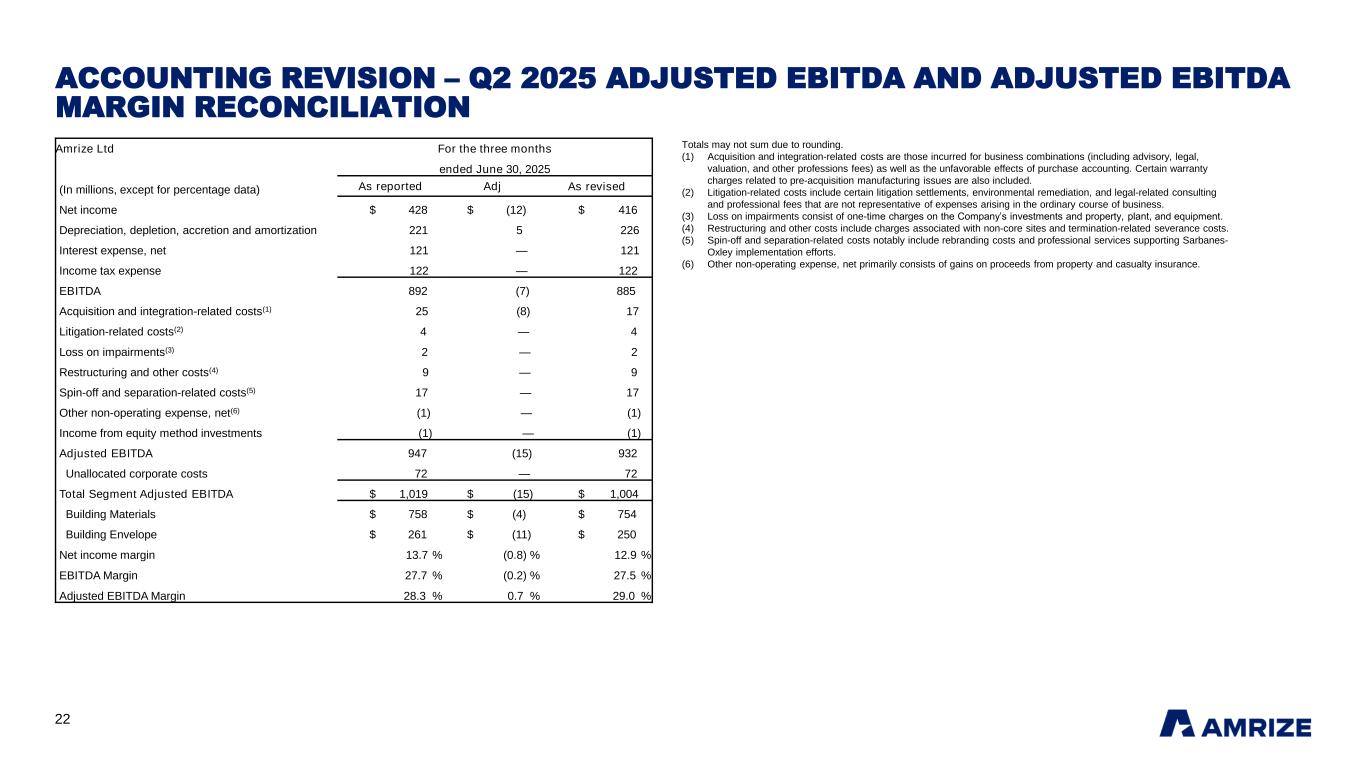
22 ACCOUNTING REVISION – Q2 2025 ADJUSTED EBITDA AND ADJUSTED EBITDA MARGIN RECONCILIATION Totals may not sum due to rounding. (1) Acquisition and integration-related costs are those incurred for business combinations (including advisory, legal, valuation, and other professions fees) as well as the unfavorable effects of purchase accounting. Certain warranty charges related to pre-acquisition manufacturing issues are also included. (2) Litigation-related costs include certain litigation settlements, environmental remediation, and legal-related consulting and professional fees that are not representative of expenses arising in the ordinary course of business. (3) Loss on impairments consist of one-time charges on the Company’s investments and property, plant, and equipment. (4) Restructuring and other costs include charges associated with non-core sites and termination-related severance costs. (5) Spin-off and separation-related costs notably include rebranding costs and professional services supporting Sarbanes- Oxley implementation efforts. (6) Other non-operating expense, net primarily consists of gains on proceeds from property and casualty insurance. Amrize Ltd For the three months ended June 30, 2025 (In millions, except for percentage data) As reported Adj As revised Net income $ 428 $ (12) $ 416 Depreciation, depletion, accretion and amortization 221 5 226 Interest expense, net 121 — 121 Income tax expense 122 — 122 EBITDA 892 (7) 885 Acquisition and integration-related costs(1) 25 (8) 17 Litigation-related costs(2) 4 — 4 Loss on impairments(3) 2 — 2 Restructuring and other costs(4) 9 — 9 Spin-off and separation-related costs(5) 17 — 17 Other non-operating expense, net(6) (1) — (1) Income from equity method investments (1) — (1) Adjusted EBITDA 947 (15) 932 Unallocated corporate costs 72 — 72 Total Segment Adjusted EBITDA $ 1,019 $ (15) $ 1,004 Building Materials $ 758 $ (4) $ 754 Building Envelope $ 261 $ (11) $ 250 Net income margin 13.7 % (0.8) % 12.9 % EBITDA Margin 27.7 % (0.2) % 27.5 % Adjusted EBITDA Margin 28.3 % 0.7 % 29.0 %
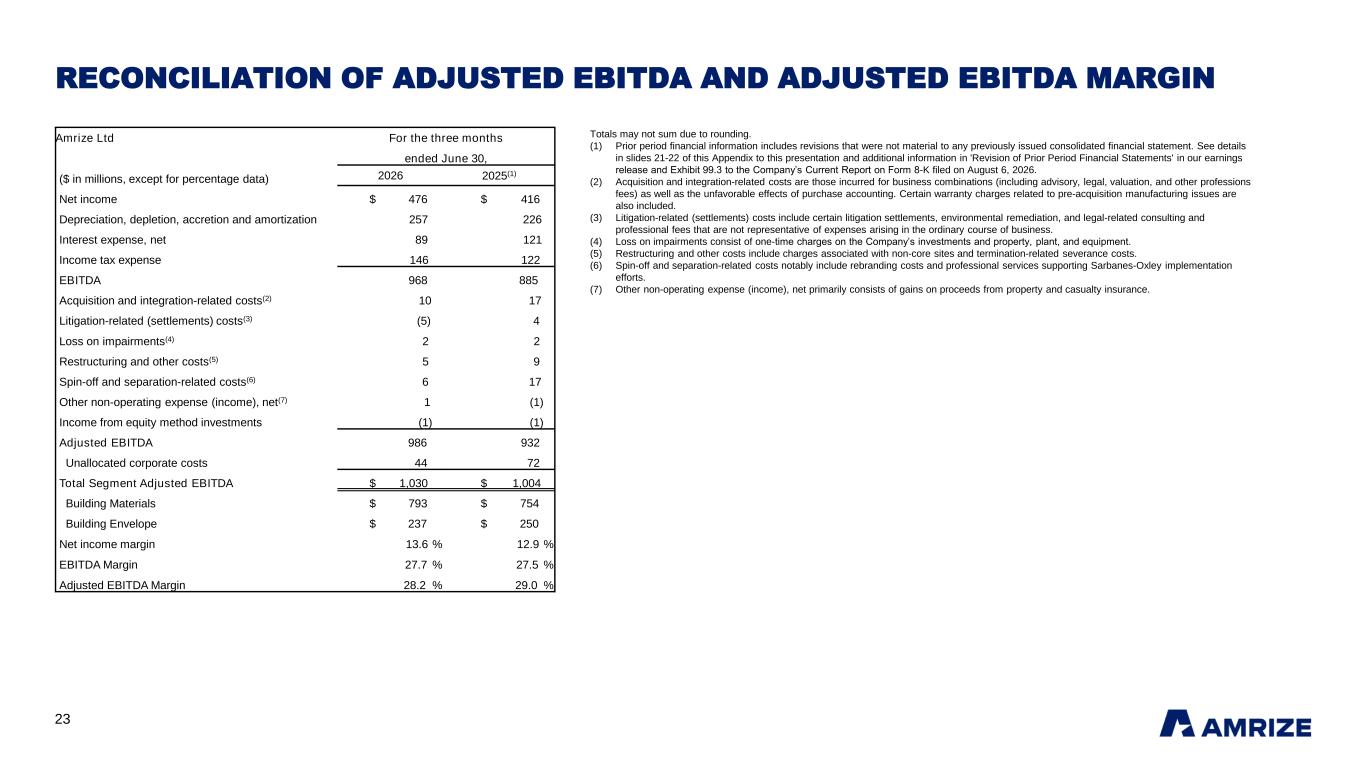
23 RECONCILIATION OF ADJUSTED EBITDA AND ADJUSTED EBITDA MARGIN Totals may not sum due to rounding. (1) Prior period financial information includes revisions that were not material to any previously issued consolidated financial statement. See details in slides 21-22 of this Appendix to this presentation and additional information in 'Revision of Prior Period Financial Statements' in our earnings release and Exhibit 99.3 to the Company’s Current Report on Form 8-K filed on August 6, 2026. (2) Acquisition and integration-related costs are those incurred for business combinations (including advisory, legal, valuation, and other professions fees) as well as the unfavorable effects of purchase accounting. Certain warranty charges related to pre-acquisition manufacturing issues are also included. (3) Litigation-related (settlements) costs include certain litigation settlements, environmental remediation, and legal-related consulting and professional fees that are not representative of expenses arising in the ordinary course of business. (4) Loss on impairments consist of one-time charges on the Company’s investments and property, plant, and equipment. (5) Restructuring and other costs include charges associated with non-core sites and termination-related severance costs. (6) Spin-off and separation-related costs notably include rebranding costs and professional services supporting Sarbanes-Oxley implementation efforts. (7) Other non-operating expense (income), net primarily consists of gains on proceeds from property and casualty insurance. Amrize Ltd For the three months ended June 30, ($ in millions, except for percentage data) 2026 2025(1) Net income $ 476 $ 416 Depreciation, depletion, accretion and amortization 257 226 Interest expense, net 89 121 Income tax expense 146 122 EBITDA 968 885 Acquisition and integration-related costs(2) 10 17 Litigation-related (settlements) costs(3) (5) 4 Loss on impairments(4) 2 2 Restructuring and other costs(5) 5 9 Spin-off and separation-related costs(6) 6 17 Other non-operating expense (income), net(7) 1 (1) Income from equity method investments (1) (1) Adjusted EBITDA 986 932 Unallocated corporate costs 44 72 Total Segment Adjusted EBITDA $ 1,030 $ 1,004 Building Materials $ 793 $ 754 Building Envelope $ 237 $ 250 Net income margin 13.6 % 12.9 % EBITDA Margin 27.7 % 27.5 % Adjusted EBITDA Margin 28.2 % 29.0 %
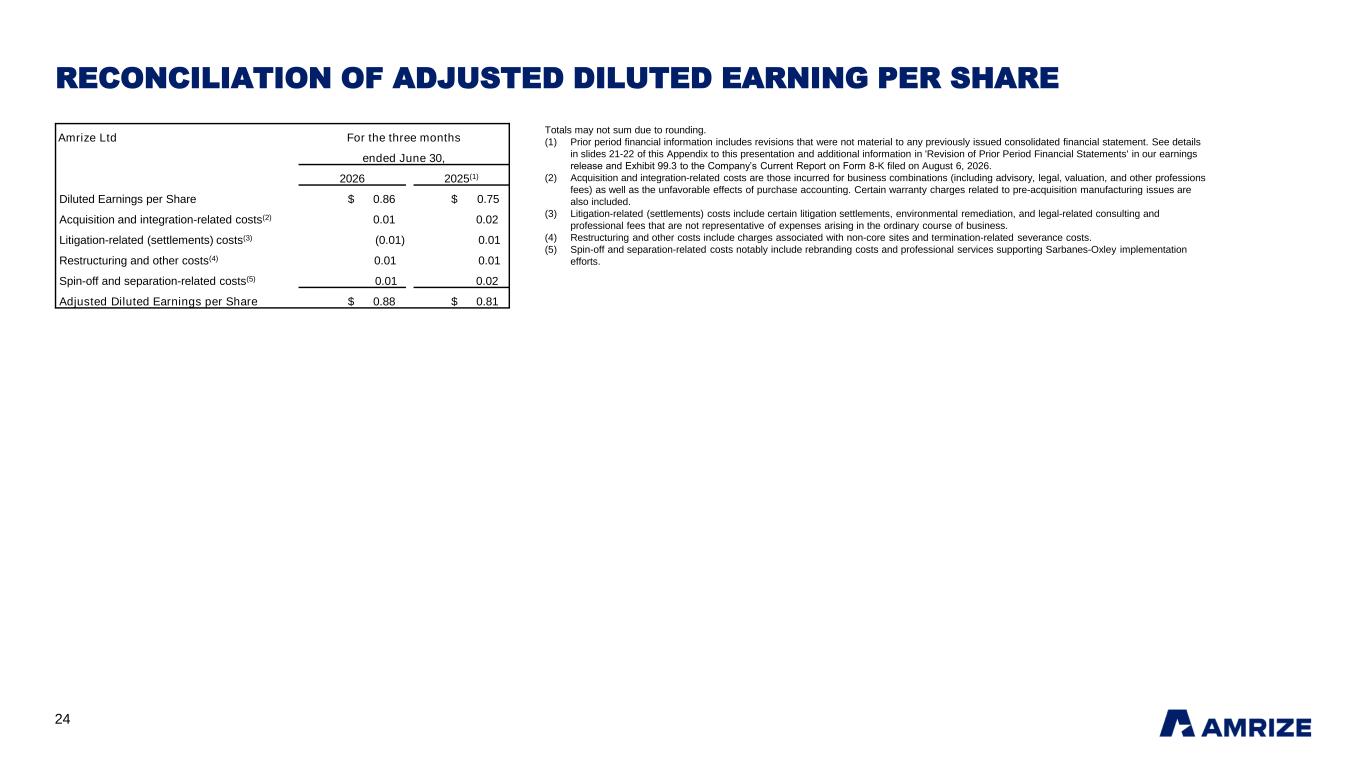
24 RECONCILIATION OF ADJUSTED DILUTED EARNING PER SHARE Totals may not sum due to rounding. (1) Prior period financial information includes revisions that were not material to any previously issued consolidated financial statement. See details in slides 21-22 of this Appendix to this presentation and additional information in 'Revision of Prior Period Financial Statements' in our earnings release and Exhibit 99.3 to the Company’s Current Report on Form 8-K filed on August 6, 2026. (2) Acquisition and integration-related costs are those incurred for business combinations (including advisory, legal, valuation, and other professions fees) as well as the unfavorable effects of purchase accounting. Certain warranty charges related to pre-acquisition manufacturing issues are also included. (3) Litigation-related (settlements) costs include certain litigation settlements, environmental remediation, and legal-related consulting and professional fees that are not representative of expenses arising in the ordinary course of business. (4) Restructuring and other costs include charges associated with non-core sites and termination-related severance costs. (5) Spin-off and separation-related costs notably include rebranding costs and professional services supporting Sarbanes-Oxley implementation efforts. Amrize Ltd For the three months ended June 30, 2026 2025(1) Diluted Earnings per Share $ 0.86 $ 0.75 Acquisition and integration-related costs(2) 0.01 0.02 Litigation-related (settlements) costs(3) (0.01) 0.01 Restructuring and other costs(4) 0.01 0.01 Spin-off and separation-related costs(5) 0.01 0.02 Adjusted Diluted Earnings per Share $ 0.88 $ 0.81
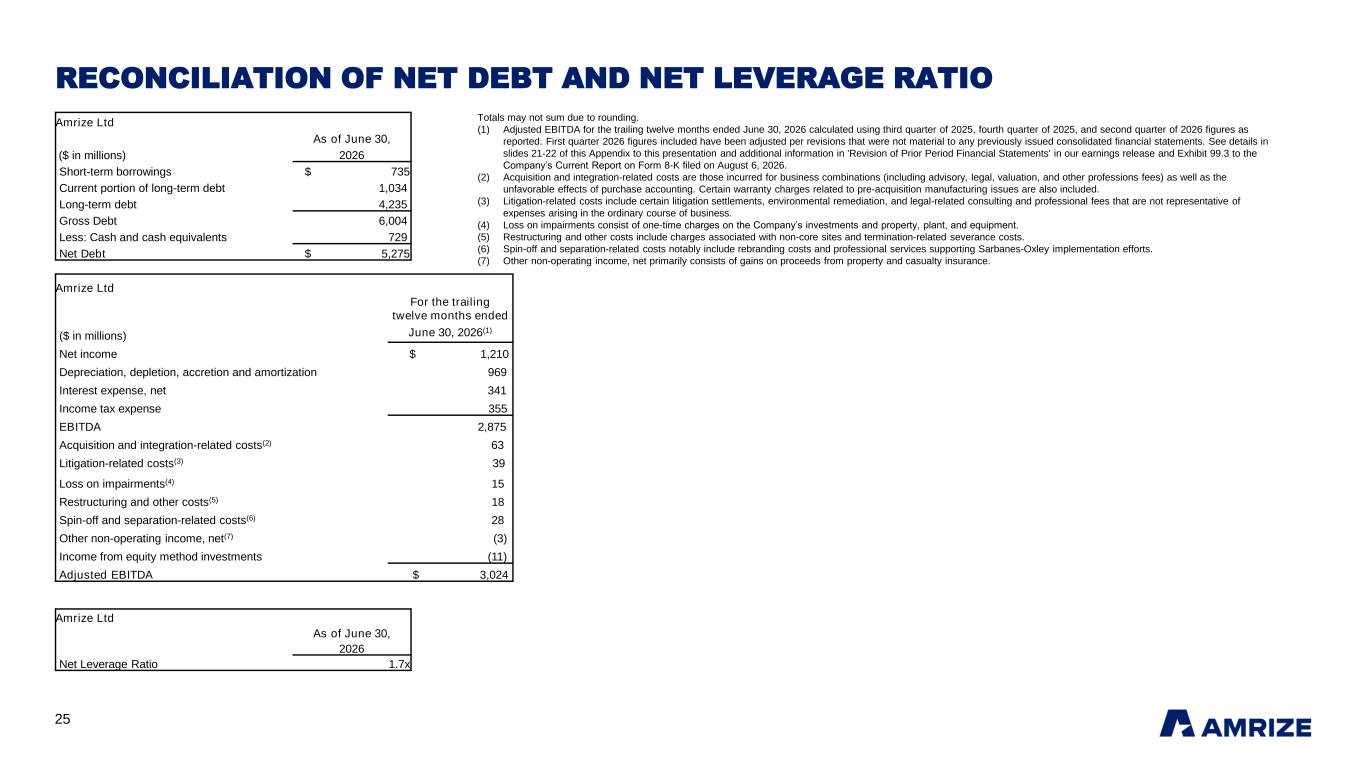
25 RECONCILIATION OF NET DEBT AND NET LEVERAGE RATIO Amrize Ltd As of June 30, ($ in millions) 2026 Short-term borrowings $ 735 Current portion of long-term debt 1,034 Long-term debt 4,235 Gross Debt 6,004 Less: Cash and cash equivalents 729 Net Debt $ 5,275 Amrize Ltd As of June 30, 2026 Net Leverage Ratio 1.7x Totals may not sum due to rounding. (1) Adjusted EBITDA for the trailing twelve months ended June 30, 2026 calculated using third quarter of 2025, fourth quarter of 2025, and second quarter of 2026 figures as reported. First quarter 2026 figures included have been adjusted per revisions that were not material to any previously issued consolidated financial statements. See details in slides 21-22 of this Appendix to this presentation and additional information in 'Revision of Prior Period Financial Statements' in our earnings release and Exhibit 99.3 to the Company’s Current Report on Form 8-K filed on August 6, 2026. (2) Acquisition and integration-related costs are those incurred for business combinations (including advisory, legal, valuation, and other professions fees) as well as the unfavorable effects of purchase accounting. Certain warranty charges related to pre-acquisition manufacturing issues are also included. (3) Litigation-related costs include certain litigation settlements, environmental remediation, and legal-related consulting and professional fees that are not representative of expenses arising in the ordinary course of business. (4) Loss on impairments consist of one-time charges on the Company’s investments and property, plant, and equipment. (5) Restructuring and other costs include charges associated with non-core sites and termination-related severance costs. (6) Spin-off and separation-related costs notably include rebranding costs and professional services supporting Sarbanes-Oxley implementation efforts. (7) Other non-operating income, net primarily consists of gains on proceeds from property and casualty insurance. Amrize Ltd For the trailing twelve months ended ($ in millions) June 30, 2026(1) Net income $ 1,210 Depreciation, depletion, accretion and amortization 969 Interest expense, net 341 Income tax expense 355 EBITDA 2,875 Acquisition and integration-related costs(2) 63 Litigation-related costs(3) 39 Loss on impairments(4) 15 Restructuring and other costs(5) 18 Spin-off and separation-related costs(6) 28 Other non-operating income, net(7) (3) Income from equity method investments (11) Adjusted EBITDA $ 3,024
© 2026 Amrize. All rights reserved.